


How We Earned a Gear Brand Over $1M In Annualized Revenue
How we helped RTIC Outdoors boost projected annual revenue by $1M+ through strategic product carousel image optimization and A/B testing.

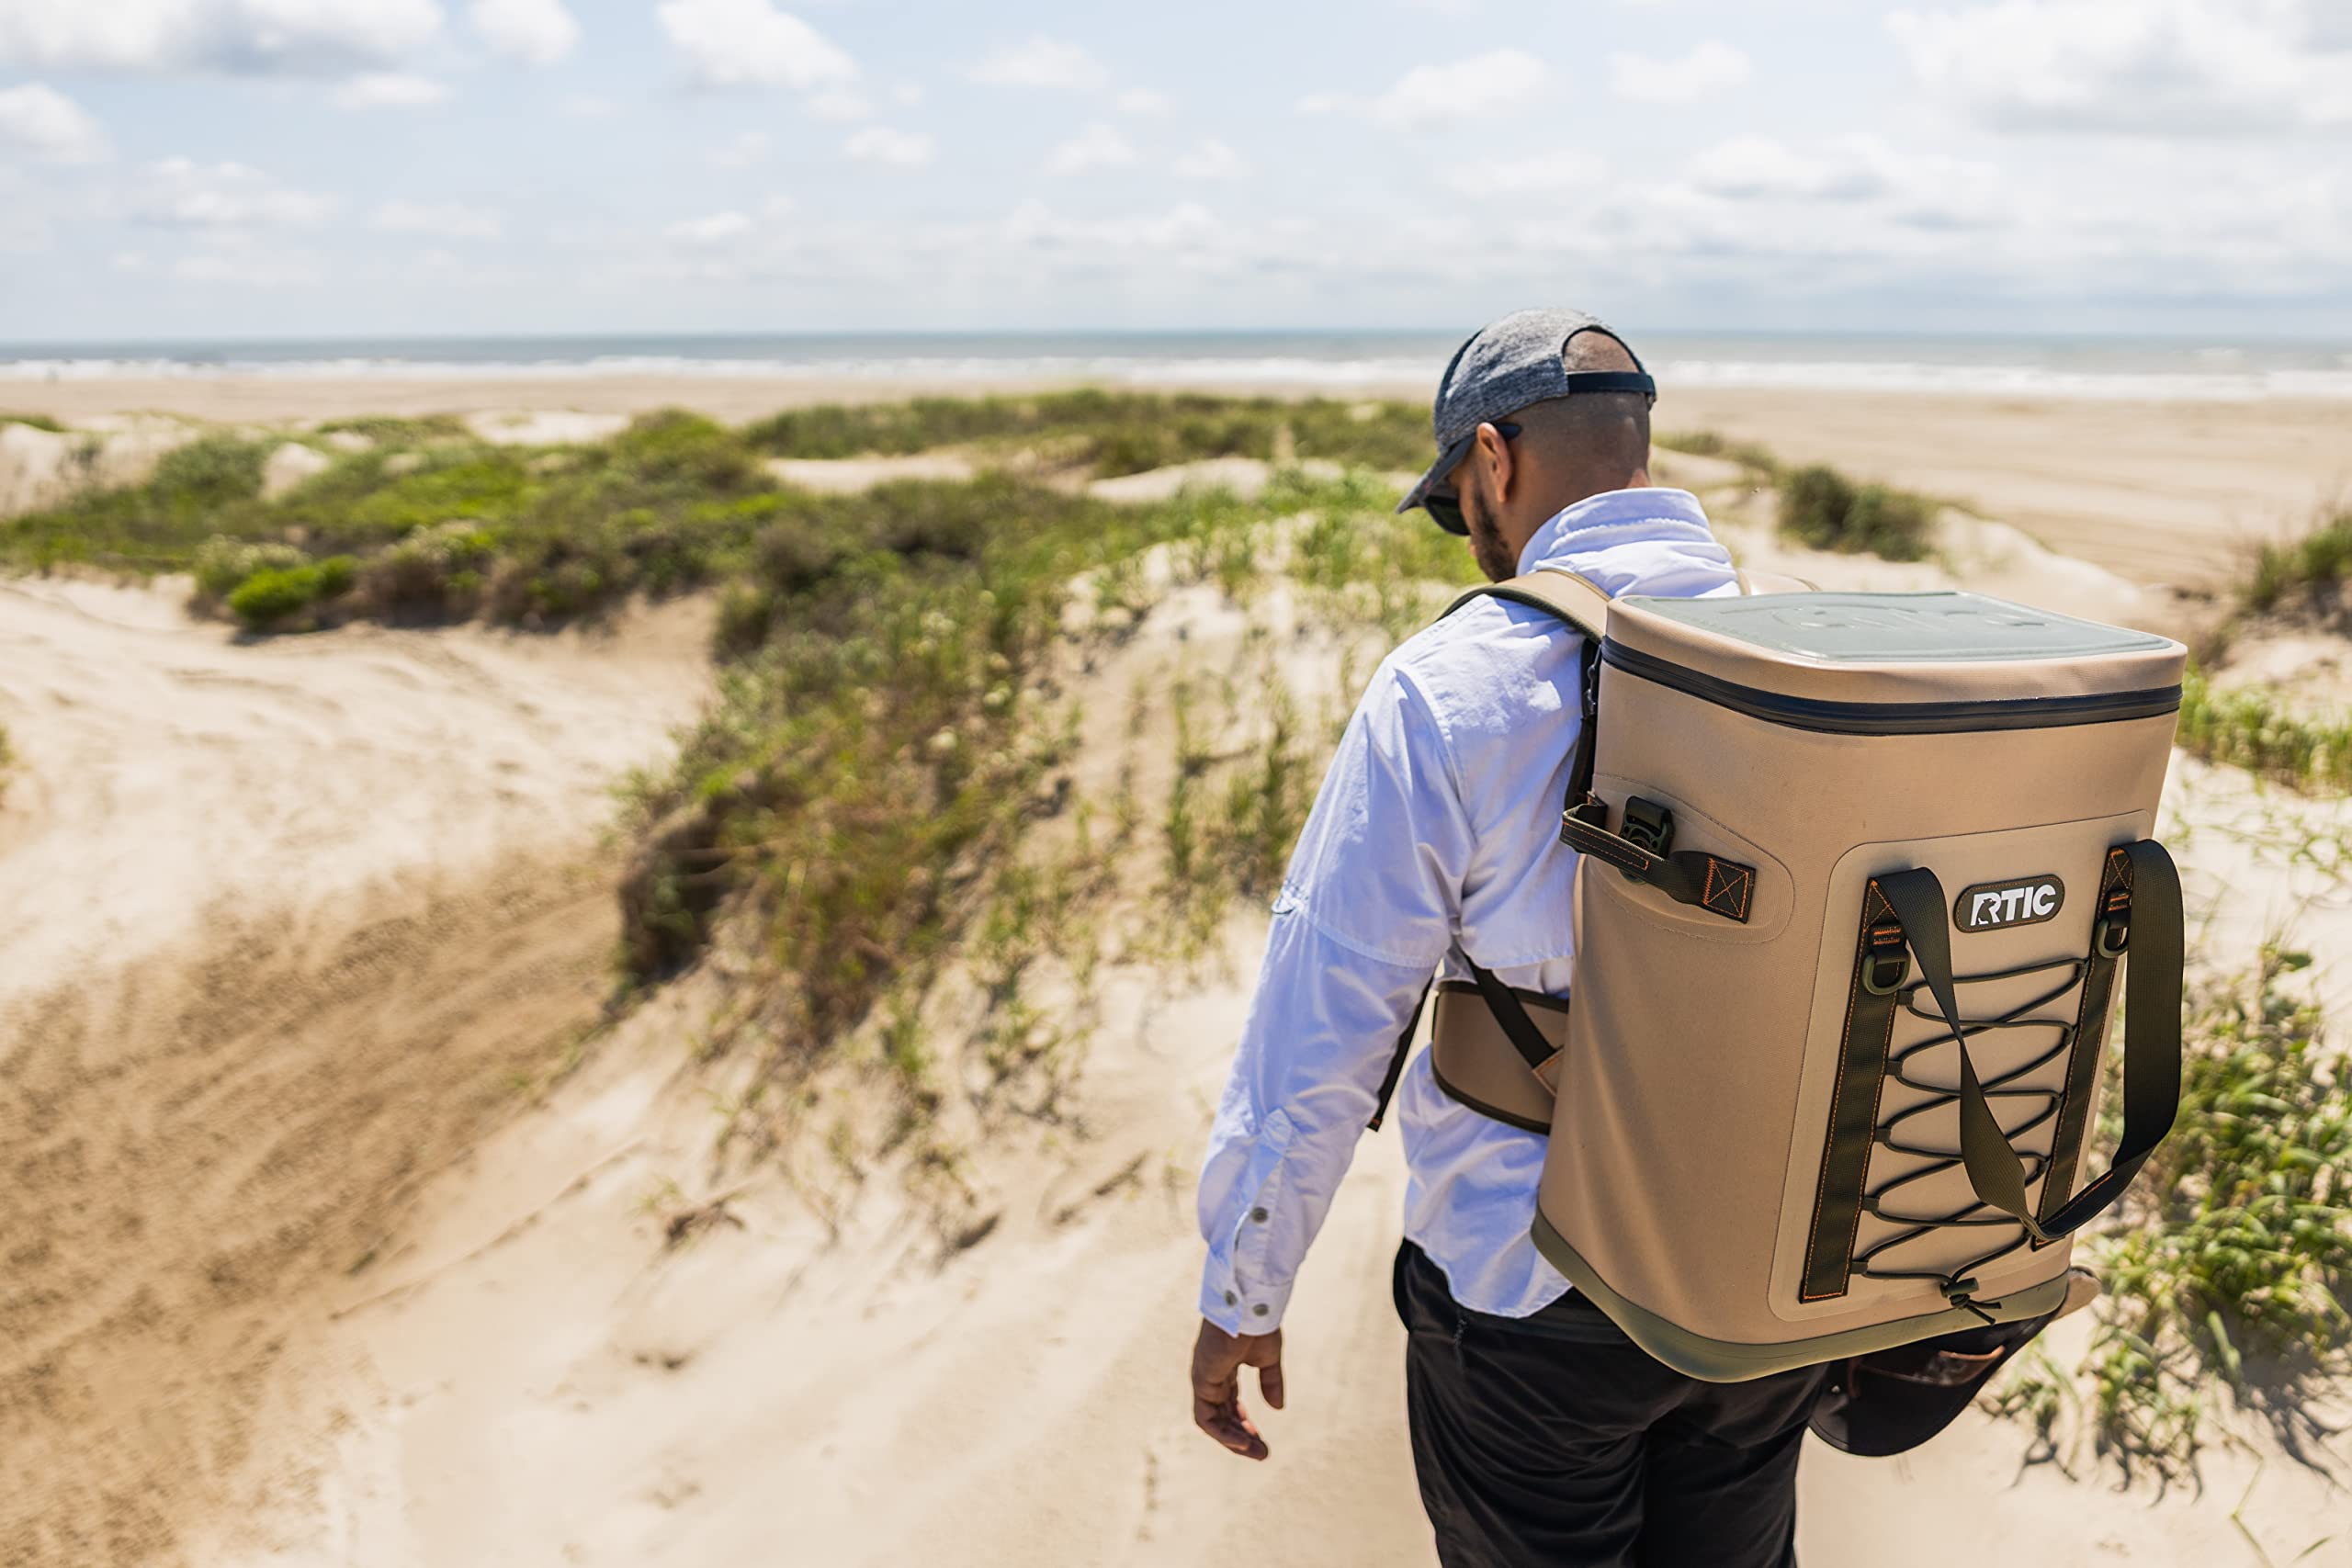
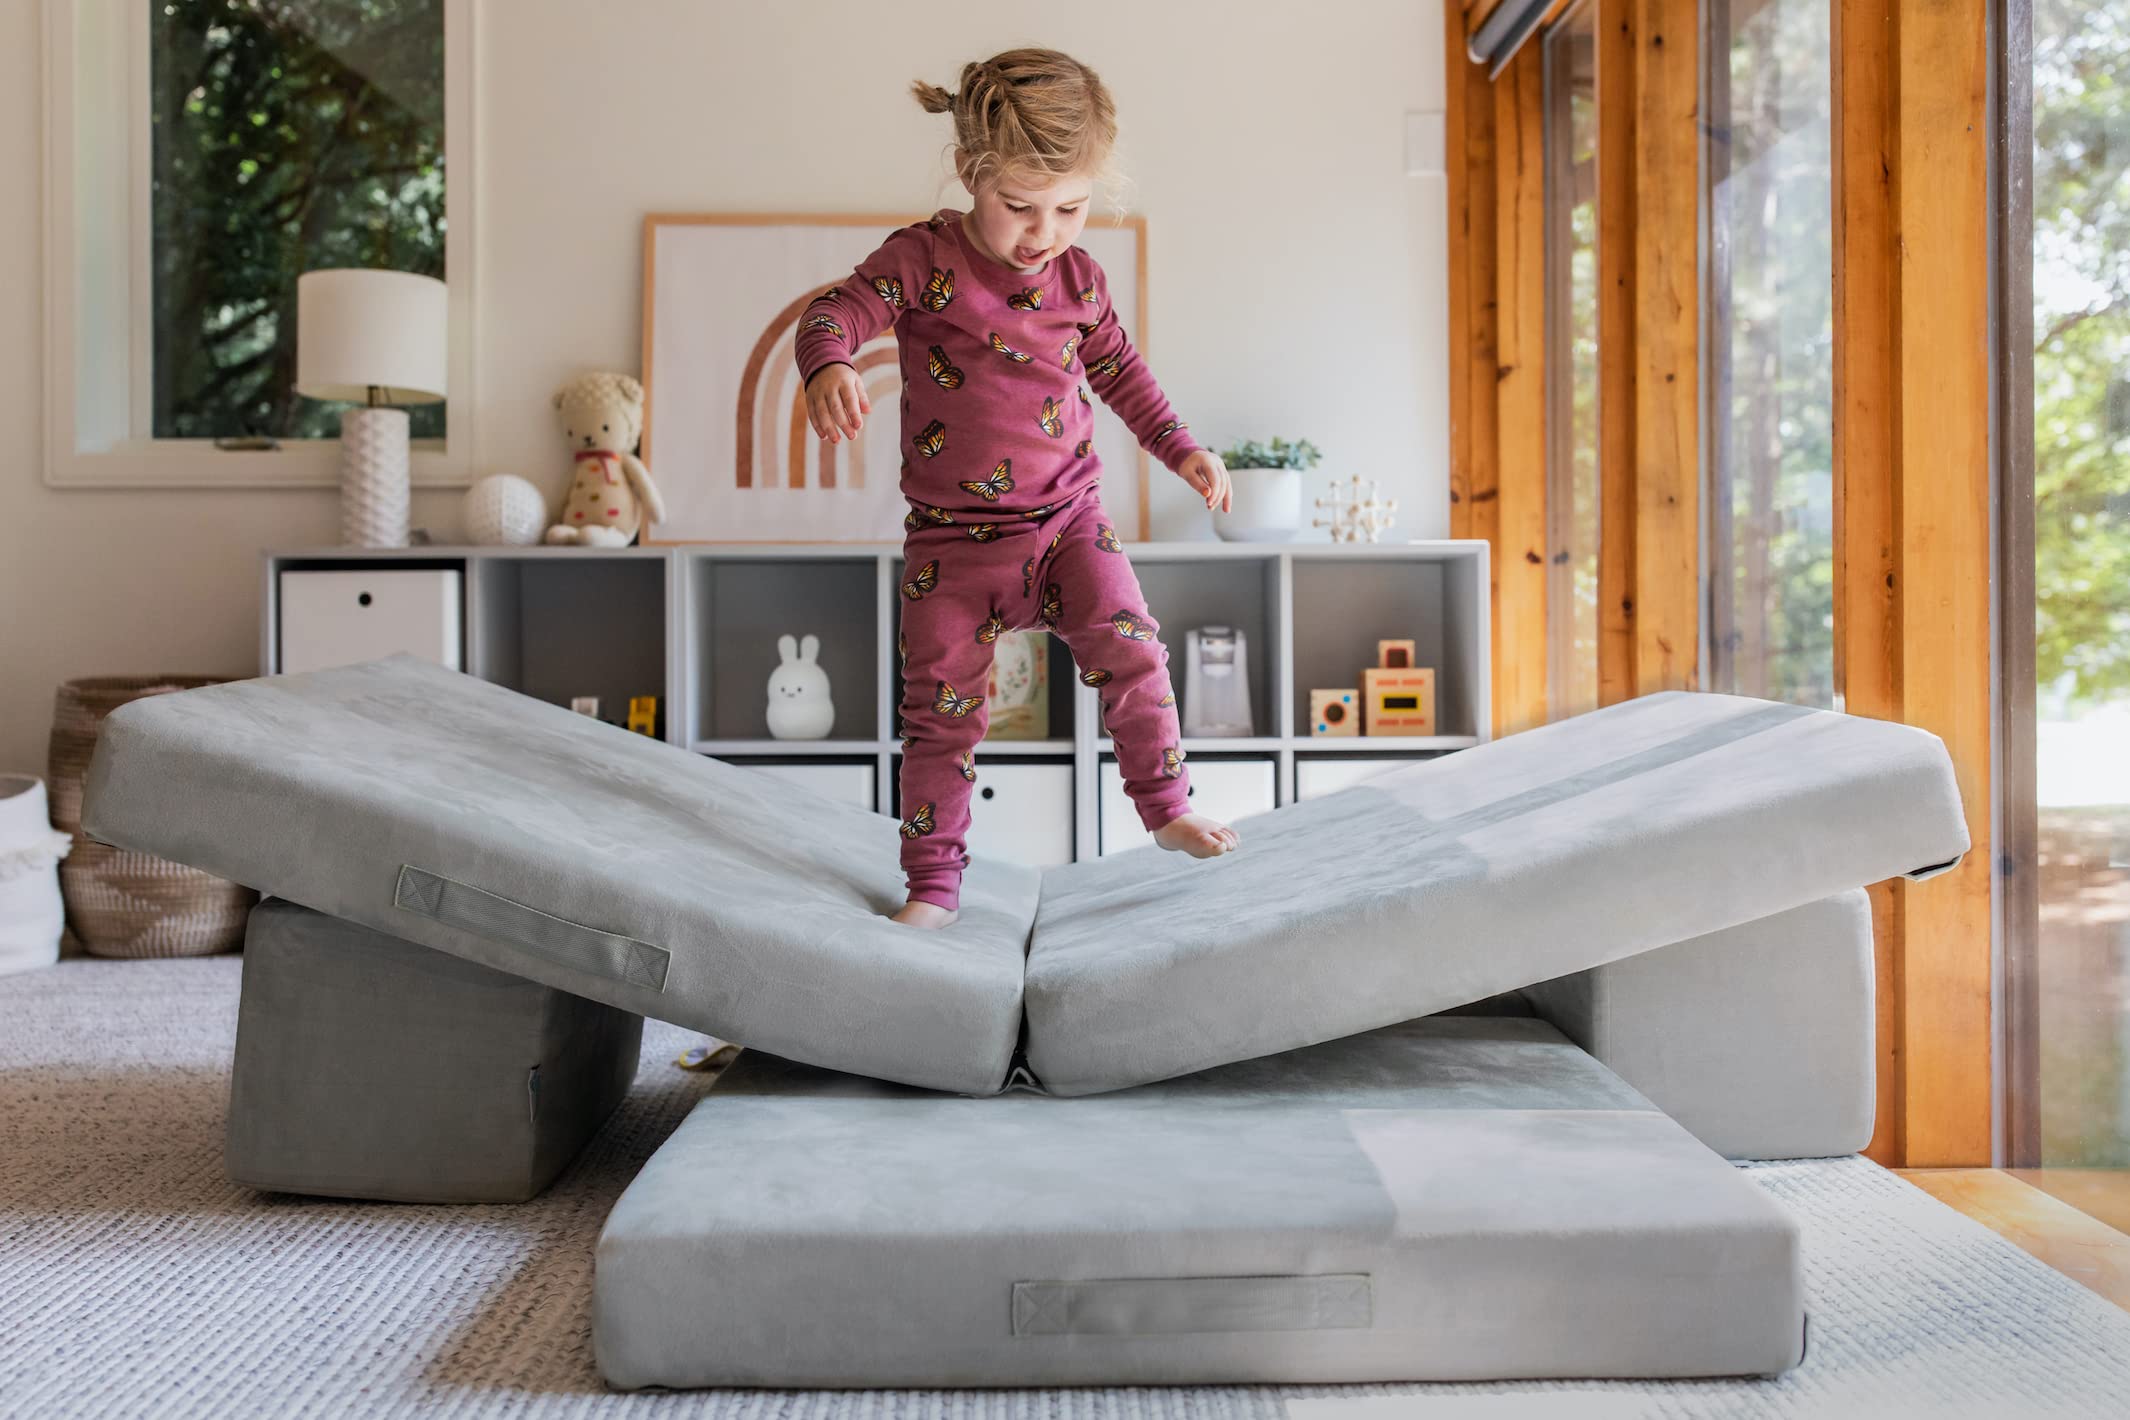
RTIC Outdoors is a Houston, Texas-based retailer of gear engineered to help you enjoy your time at the beach, at the game, and anywhere you’re looking to maximize your time outside. (Think: high-quality coolers, drinkware, and bags in a variety of colors and prints.)
I. Brief
II. The Opening
III. The Swap
IV. The Results
V. Conclusion
I. The Brief
RTIC wanted to see meaningful change. To produce meaningful change, you need to make meaningful change — and so early in this engagement, we were focused on big switches that would drive significant increases in revenue and margin without creating a massive technical debt.
II. The Opening
Through our research, we flagged one specific thing in each of our tests: the carousel images.
Our first pass through the heuristics analysis indicated that there was room for considerable improvement. We realized this wouldn’t be an easy thing to fix. We simultaneously underestimated the limitations we would face while angling to fix them.
RTIC has millions, not thousands of visitors to its website every month, which means that their site and user experience is already pretty finely tuned. We took a few shots at some low-hanging fruit on the website, but we really weren’t moving the needle in an interesting way.
Back to those carousel images. As we started looking deeper into our user testing results — onsite and offsite surveys with loyal customers, post-purchasers, and their internal customer service team — we discovered one recurring issue. The product carousel images were not doing their job.
III. The Swap
The product carousel should be the top, if not the second-most, interacted-with element on a PDP. For some products, it was. Usually, though, it wasn’t, which meant that many visitors lacked a crucial piece of information. While the carousel images were exceptionally high quality, they didn’t share any product information: no measurements, no lifestyle photos for context, no specifications, no flavor.
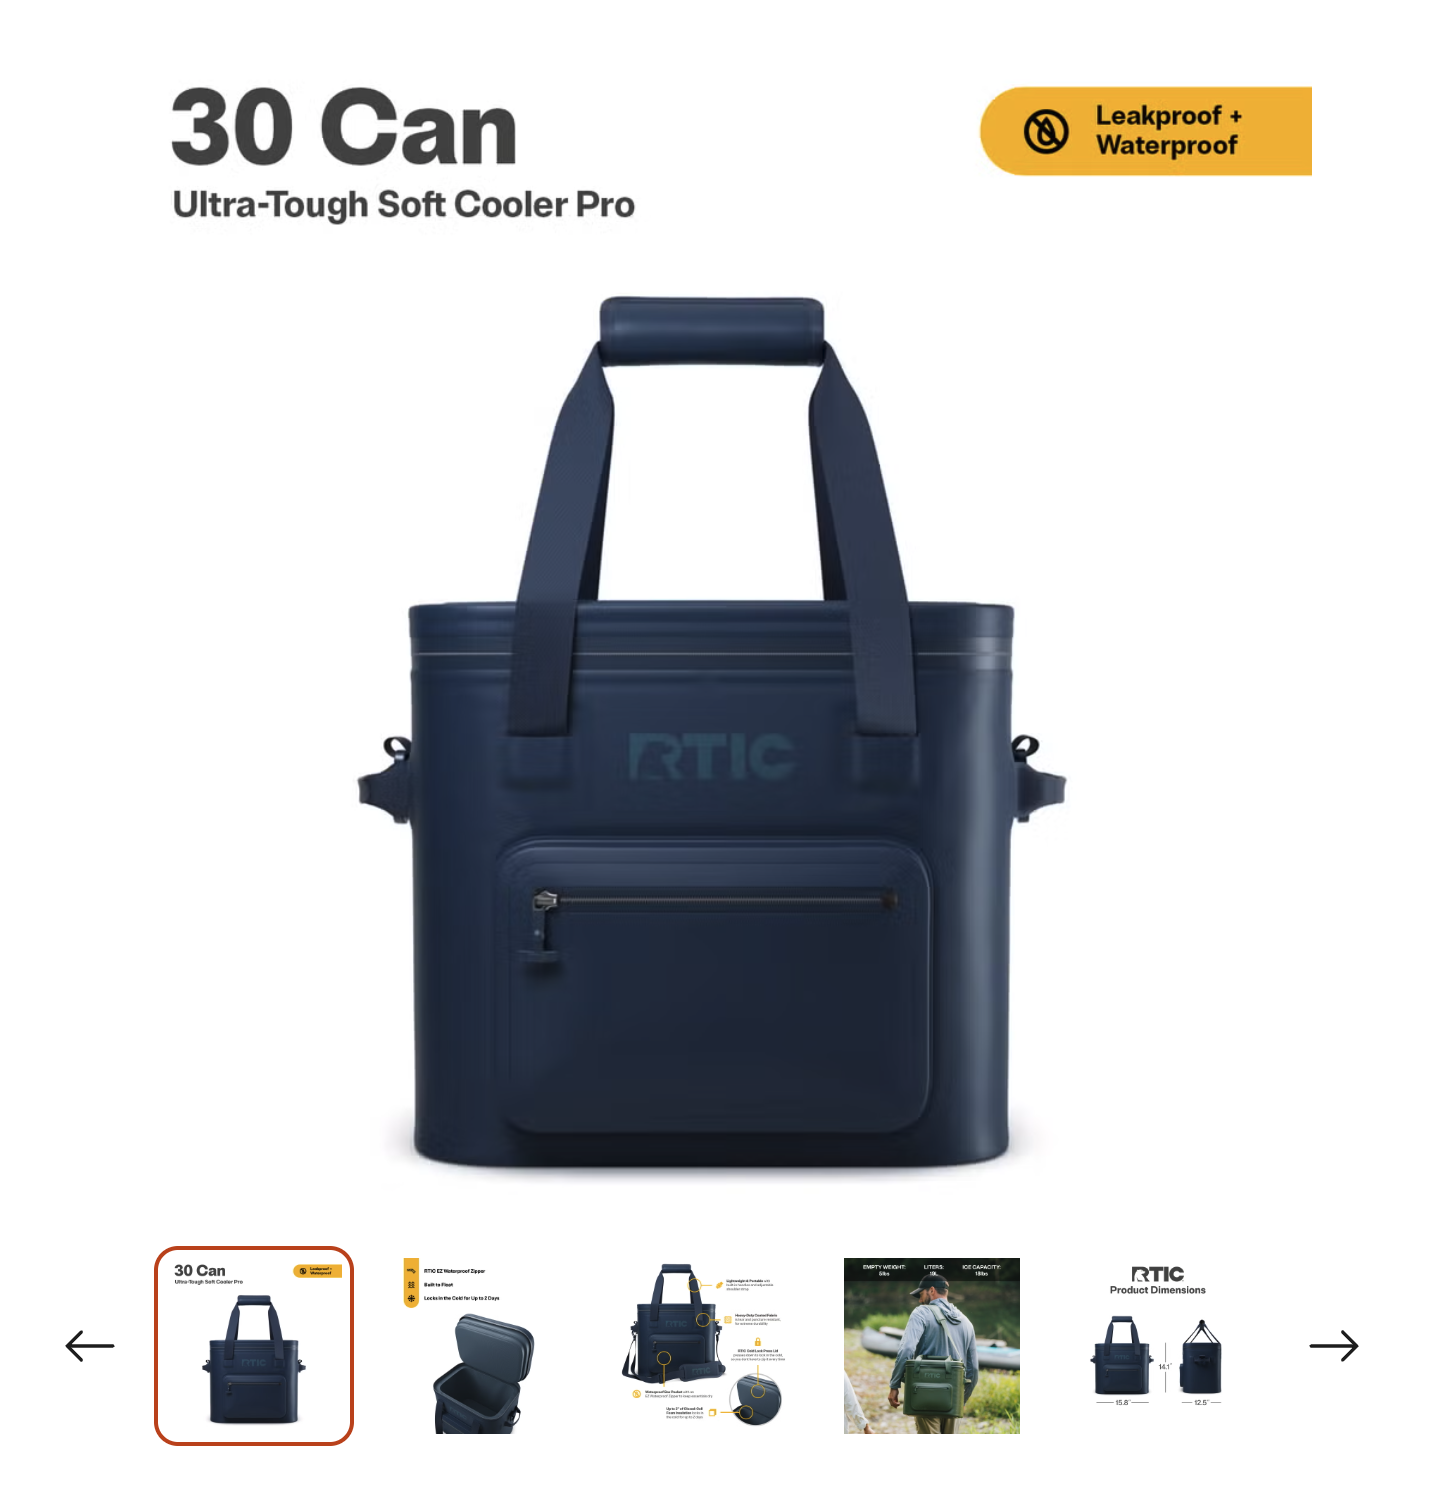
Our first pass at addressing this met significant resistance. We knew this would be a massive undertaking, but we weren’t devoid of options. The product images used for marketplaces like Wal-Mart.com actually had a lot of what we were looking for. We could use these images as a way to test (and demonstrate) proof of concept. From there, we could decide if a major image overhaul made sense operationally and financially.
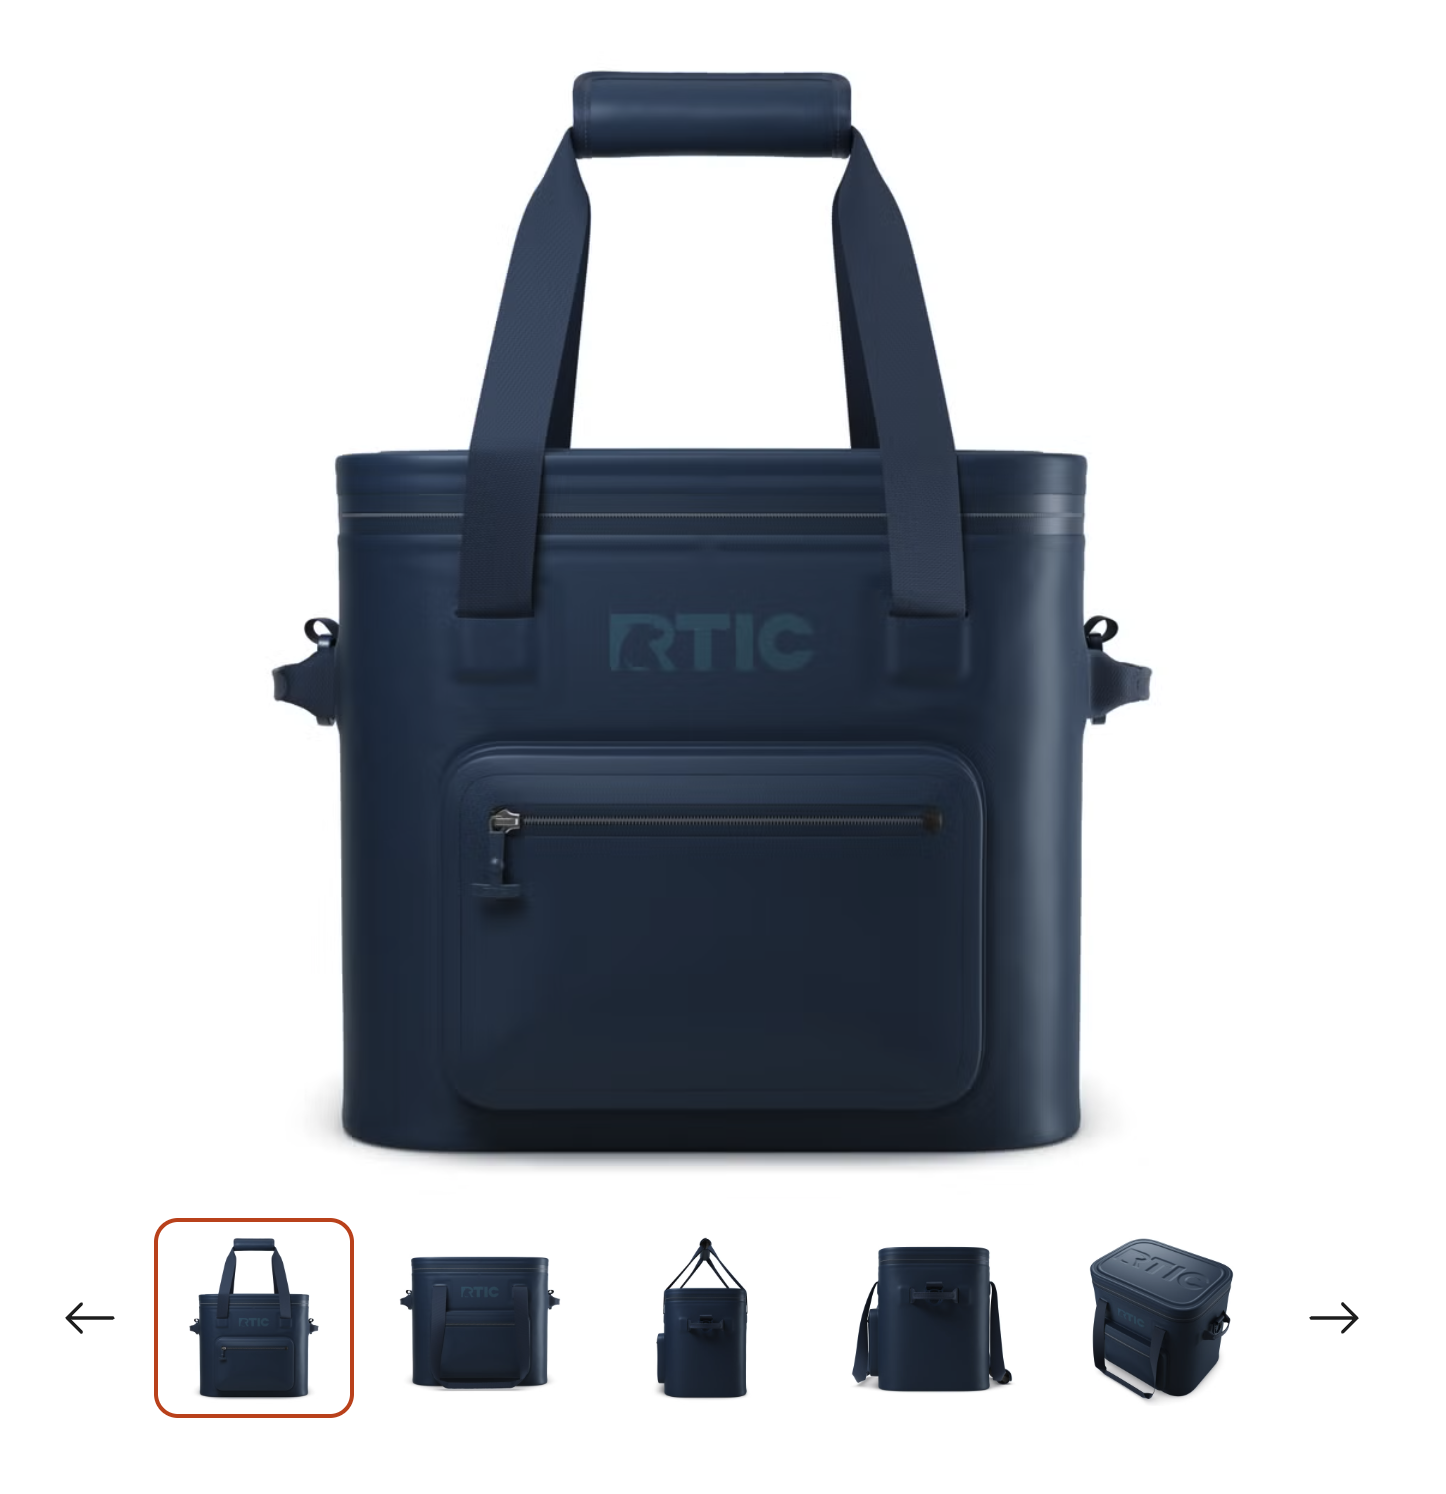
Current Images:
What we tested:
The results speak for themselves. We tested four different products separately, selected by two factors: the additional images available and those we thought would get a positive response and/or not completely crash the conversion rate if we missed the mark.

The Ultra-Tough Soft Cooler Pro and the 32-Quart Ultra-Light delivered a combined $1M+ in projected annual revenue increases.

IV. The Results
Two came back a little flat, but the Ultra-Tough Soft Cooler Pro and the 32 Quart Ultra Light cooler absolutely crushed it, resulting in a significant annualized revenue uplift between the two products of over $1 million: $300,000 for the Ultra-Tough Soft Cooler Pro and $750,000 for the 32-Quart Ultra-Light.
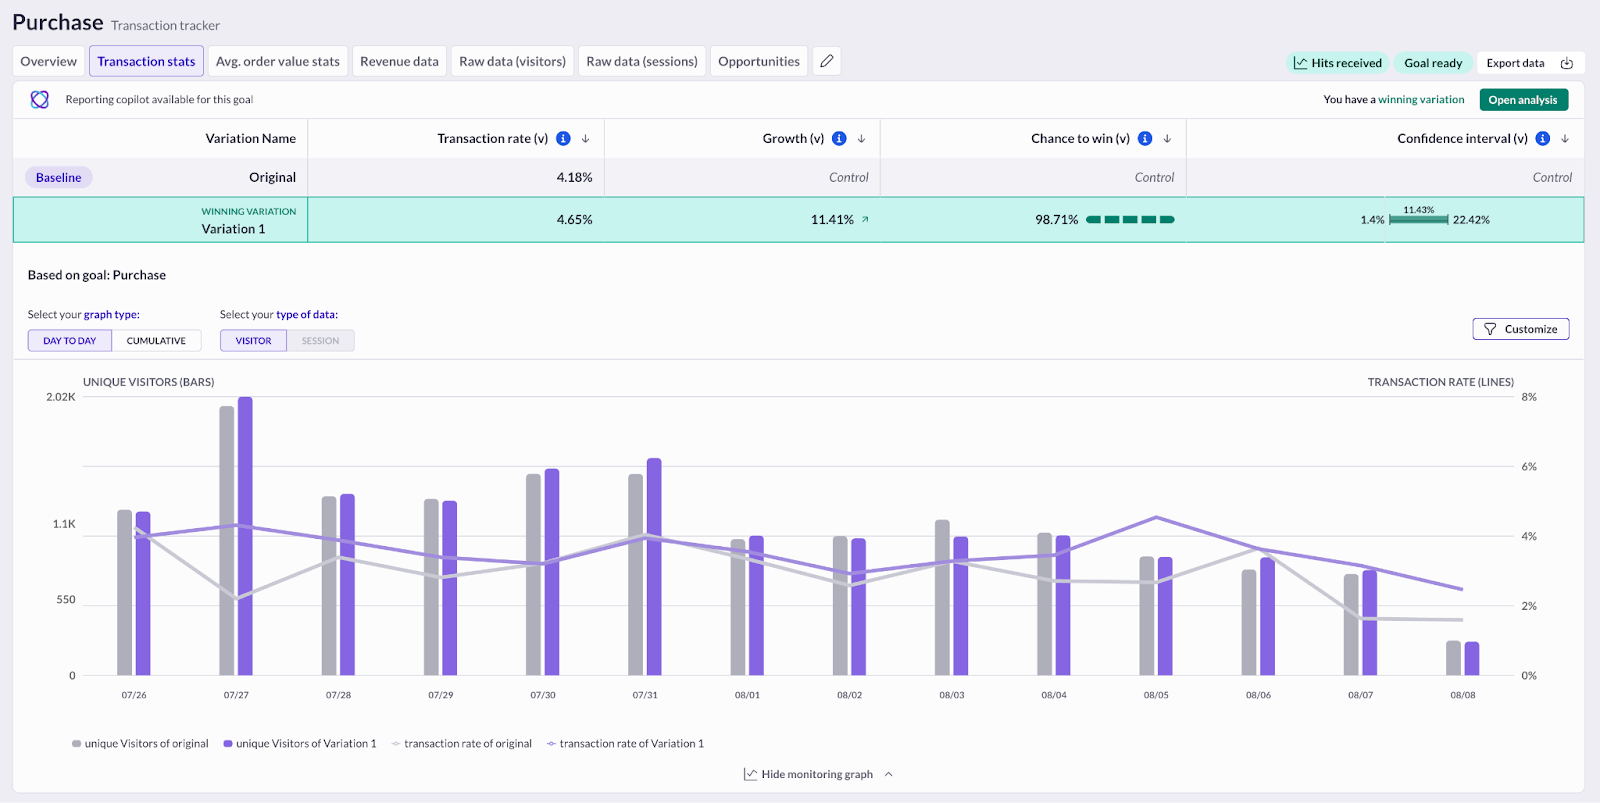
Ultra-Tough Soft Cooler Pro
- Purchases
- Original: 4.18%
- Variation: 4.58%
- Uplift: 11.41%
- Confidence Interval: 98.71%
- Revenue Per User
- Original: $7.27
- Variation: $7.72
- Uplift: 7.1%
- Revenue:
- Revenue Uplift: $17,220.57
- Potential Annual uplift: ~$300,000
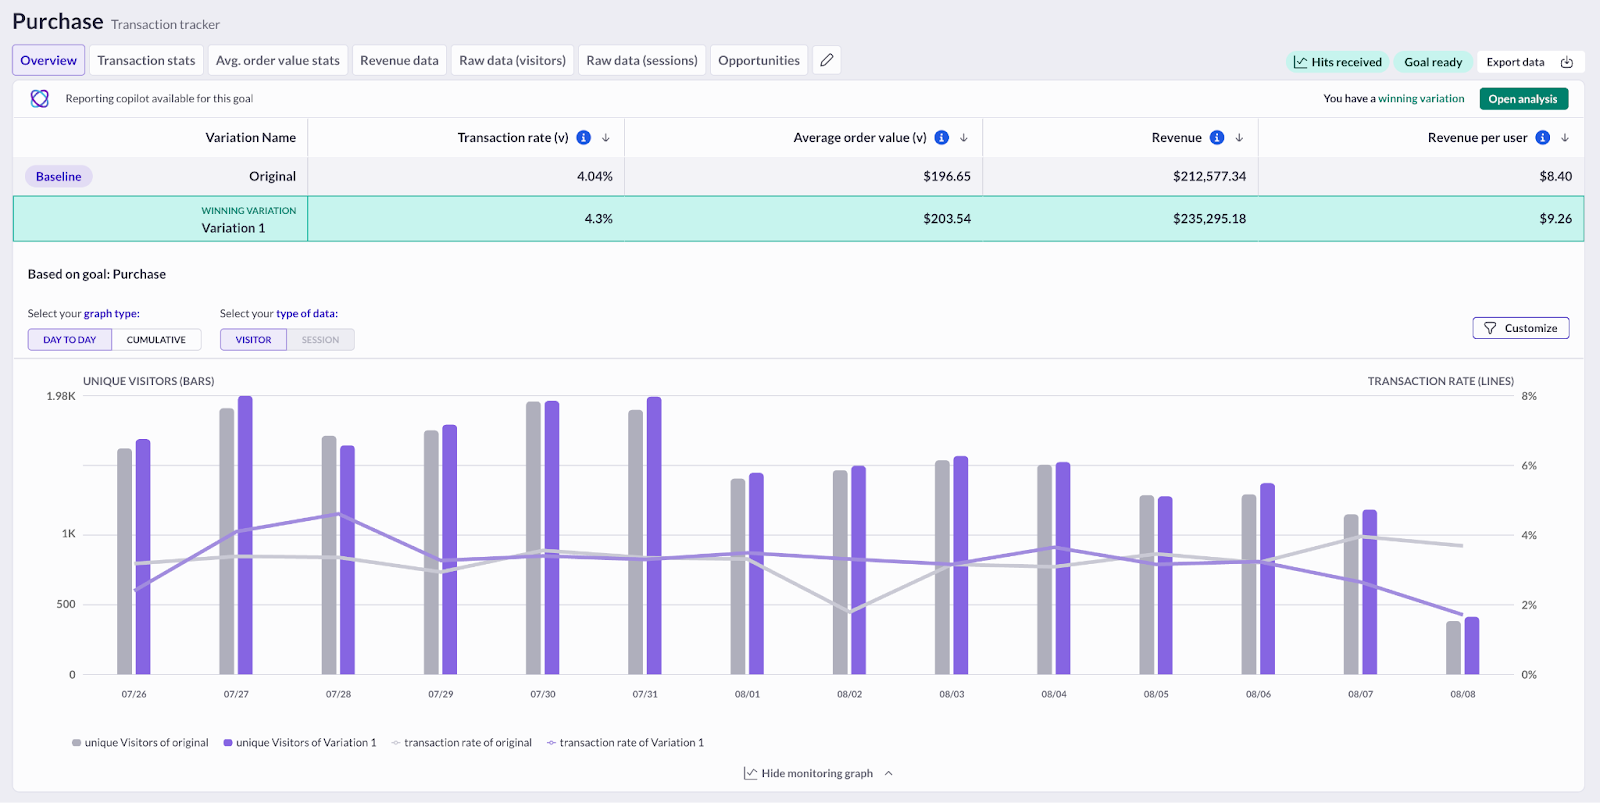
32 Quart Ultra-Light Hard Cooler
- Purchases
- Original: 4.04%
- Variation: 4.3%
- Uplift: 6.5%
- Confidence Interval: 93.21%
- Revenue Per User
- Original: $8.40
- Variation: $9.26
- Uplift: 10.24%
- Revenue:
- Revenue Uplift: $43,510.31
- Potential Annual uplift: ~$750,000
V. Conclusion
Even without full creative resources or the ability to overhaul every product image, we proved that breaking a big problem into smaller, testable pieces can deliver powerful, data-backed wins.
By identifying a single high-impact element — the carousel — and using available assets to validate our hypothesis, we unlocked over $1 million in projected annual revenue uplift. This approach didn’t just solve a UX issue; it showed that informed, incremental decisions can pave the way for meaningful change when the “perfect” solution isn’t immediately within reach.


.png)
.png)